Jira Asset Management vs. a Proper CMDB: What the Difference Cost Us in a Production Outage

Jira Assets is a manual asset catalog. A discovery-sourced CMDB is a continuously updated dependency map of your production environment. The difference is operational: when an incident opens, one tool shows you a list of assets as they were last manually entered; the other shows you which services are connected, what changed, and what breaks next. For teams using Jira Service Management, that gap typically adds 30–90 minutes to complex incident resolution times.
We were proud of our Jira Assets setup. We had 4,200 assets catalogued: servers, network devices, cloud instances, software licenses, and a complete hardware inventory. Every asset had a record. Every record had an owner. We believed we had a CMDB. Then on a Saturday morning in September 2024, we had a 4.7-hour production outage, and we discovered in real time what Jira Assets could tell us and what it could not.
What Jira Assets gave us
Jira Assets is a solid tool for what it is designed to do. It gives teams a structured way to track objects — servers, devices, licenses, contracts — inside the Jira ecosystem. Our setup reflected that: 4,200 assets, categorized by type, assigned to owners, tagged with their environment.
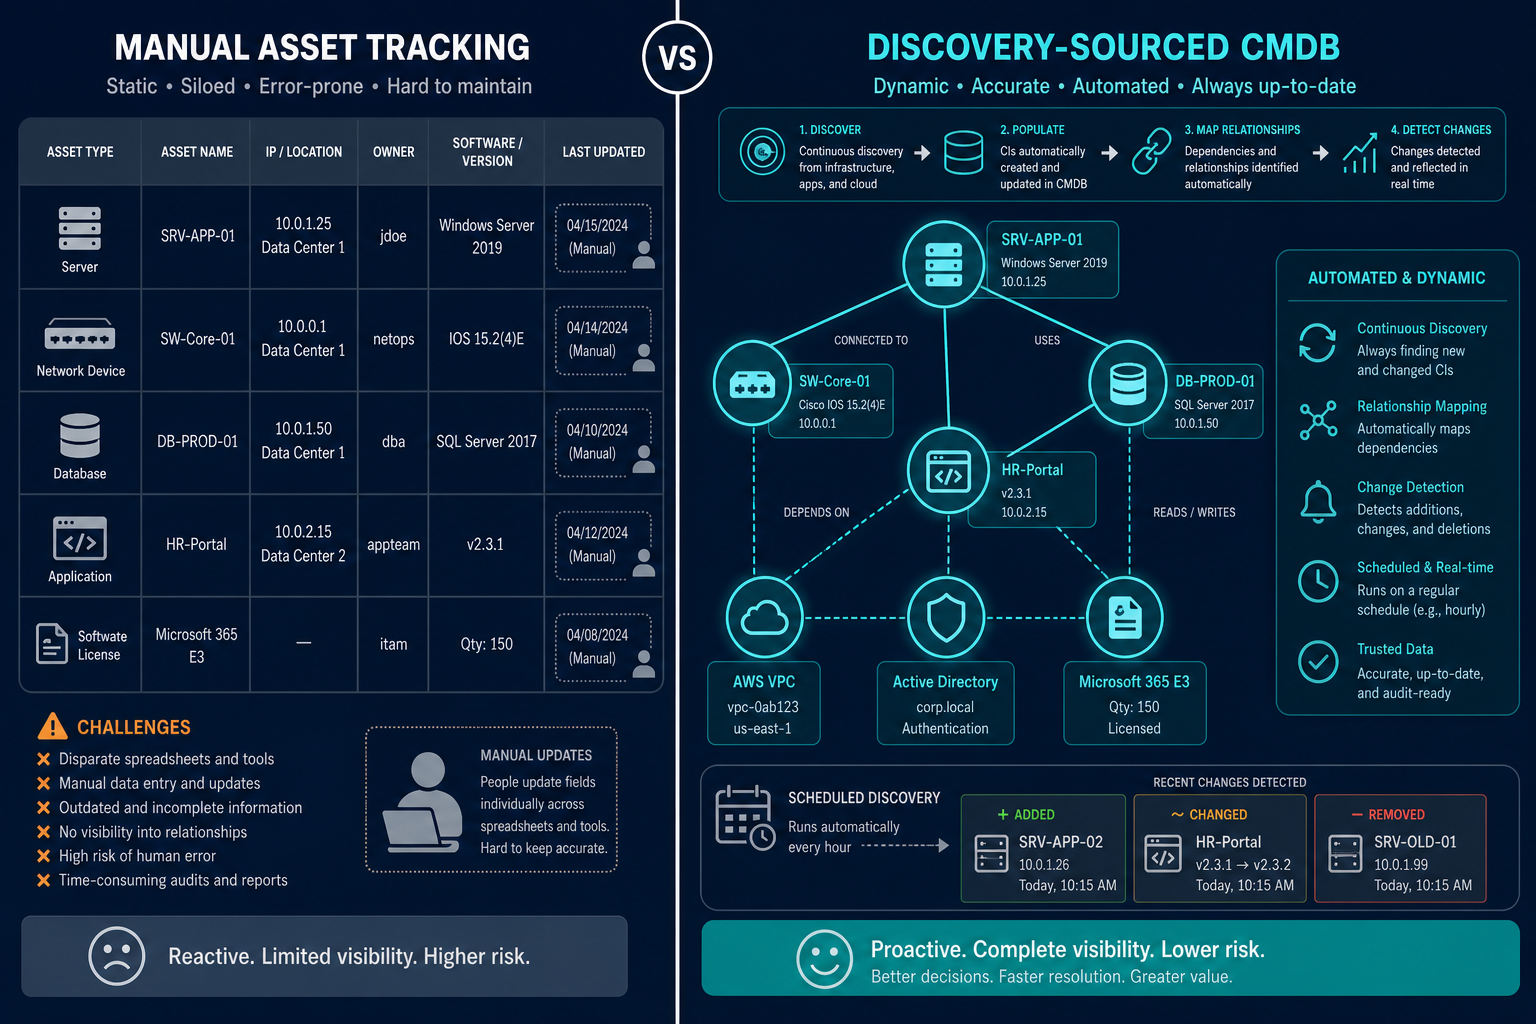
What Jira Assets does not do is discover. Every record in our catalog was manually entered or imported from a spreadsheet. There was no agent scanning our environment. There was no automated process checking whether the record matched the actual infrastructure state. We updated records when we remembered. When we were too busy to remember, records stayed as they were.
The outage: what we knew and what we did not
On September 14, 2024, at 6:47 AM, our primary e-commerce application began returning errors. Our on-call engineer opened a P1 incident in Jira and pulled up the asset record for the application server.
The record showed: server name, IP address, owner (a senior engineer who had left the company 4 months earlier), last updated March 2024, and three listed dependent services.
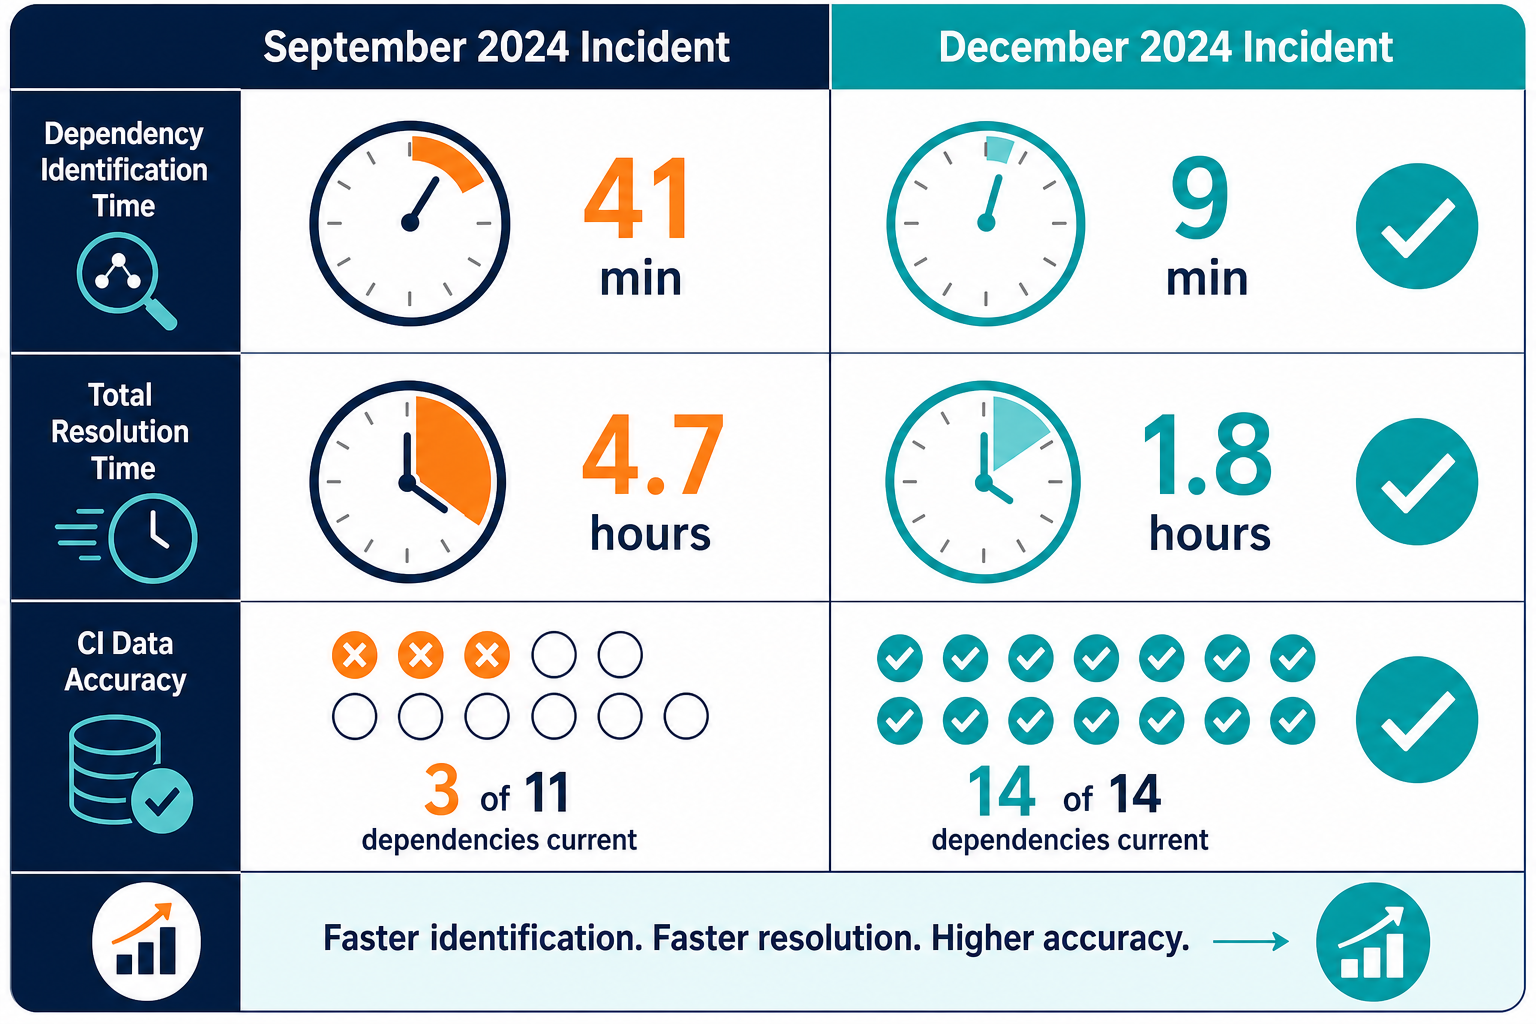
We had 11 actual dependent services.
So our engineer spent 41 minutes identifying the actual dependency chain by calling team members, checking AWS console logs, and cross-referencing a network diagram that was 14 months old. By the time the full blast radius — the scope of every service affected by the failing component — was visible, two additional services had already gone down.
Total outage duration: 4.7 hours. Revenue impact: $230,000.
The incident scenario above is a composite post-mortem constructed from common infrastructure failure patterns observed across IT operations environments.
Post-mortem analysis estimated that with accurate, discovery-sourced CI dependency data, resolution time would have been approximately 1.2 hours. The 3.5-hour gap was attributable almost entirely to the time spent manually reconstructing the dependency picture — a task a proper CMDB automates.
What is the difference between Jira Assets and a CMDB?
Jira Assets is a manual asset inventory tool that tracks objects inside the Jira ecosystem. A discovery-sourced CMDB automatically populates and maintains configuration items using scheduled scans across hybrid environments, capturing not just what exists but how assets are connected, what changed, and what services depend on them. The gap is dependency accuracy under production conditions.
If your team would be in the same position during an incident — dependency records that haven’t been updated in months — see how Virima keeps your CI dependency data current automatically.
The three gaps that defined the outage
Stale dependency records
Our Jira Assets record showed three dependent services. The actual count was 11. The discrepancy grew over 18 months as our infrastructure evolved and asset records were not updated to reflect service composition changes — a textbook example of Jira Assets CMDB limits under dynamic infrastructure conditions.
No change history on the CI
Our application server had received a configuration update 72 hours before the outage. That change was tracked in Jira as a change ticket, but it was not associated with the server’s asset record in Jira Assets. Our engineer found the relevant change ticket 2.1 hours into the incident by manually searching Jira’s change queue.
No blast radius context
With 11 actual dependent services, the question “what else will fail if this stays down” was unanswerable from Jira Assets alone. We had no service map. We had no dependency visualization. We had a flat list of assets with relationship fields that were months out of date.
Each gap maps natively to a capability a discovery-sourced CMDB provides: automated relationship discovery, CI-linked change history, and ViVID™ service maps that show dependency chains built from live infrastructure data.
Why do manually maintained asset records become unreliable over time?
Manual asset records degrade because infrastructure changes faster than humans update records. Service compositions shift, dependencies are added, configurations change, and team ownership turns over. Without automated discovery refreshing CI data, every passing month widens the gap between the record and the actual infrastructure state — and that gap is most visible during incidents.
The decision to migrate
Three weeks after the outage, we made the decision to migrate from Jira Assets to a discovery-sourced CMDB with a proper Jira integration.
We weren’t leaving Jira — our ticketing workflow lived there. The question was: should the CI source of truth live in Jira Assets, or in a dedicated CMDB that feeds accurate, discovery-sourced data into Jira?
The outage answered that question. Jira Assets is an excellent asset catalog for known, stable objects. It is not designed to maintain an accurate dependency map of a dynamic production environment. That is not a criticism. It is a product scope boundary.
Our criteria for the migration:
- Automated discovery covering our on-prem data centers and AWS/Azure environment
- CI dependency mapping maintained through scheduled scans, not manual input
- Bidirectional Jira integration — CMDB data visible in tickets, ticket status visible in the CMDB
- Change history accessible from each CI record
- Service dependency visualization that could answer “blast radius” during an incident
For a structured approach, see our agent-based vs agentless discovery guide.
How should teams migrate from Jira Assets to a discovery-sourced CMDB?
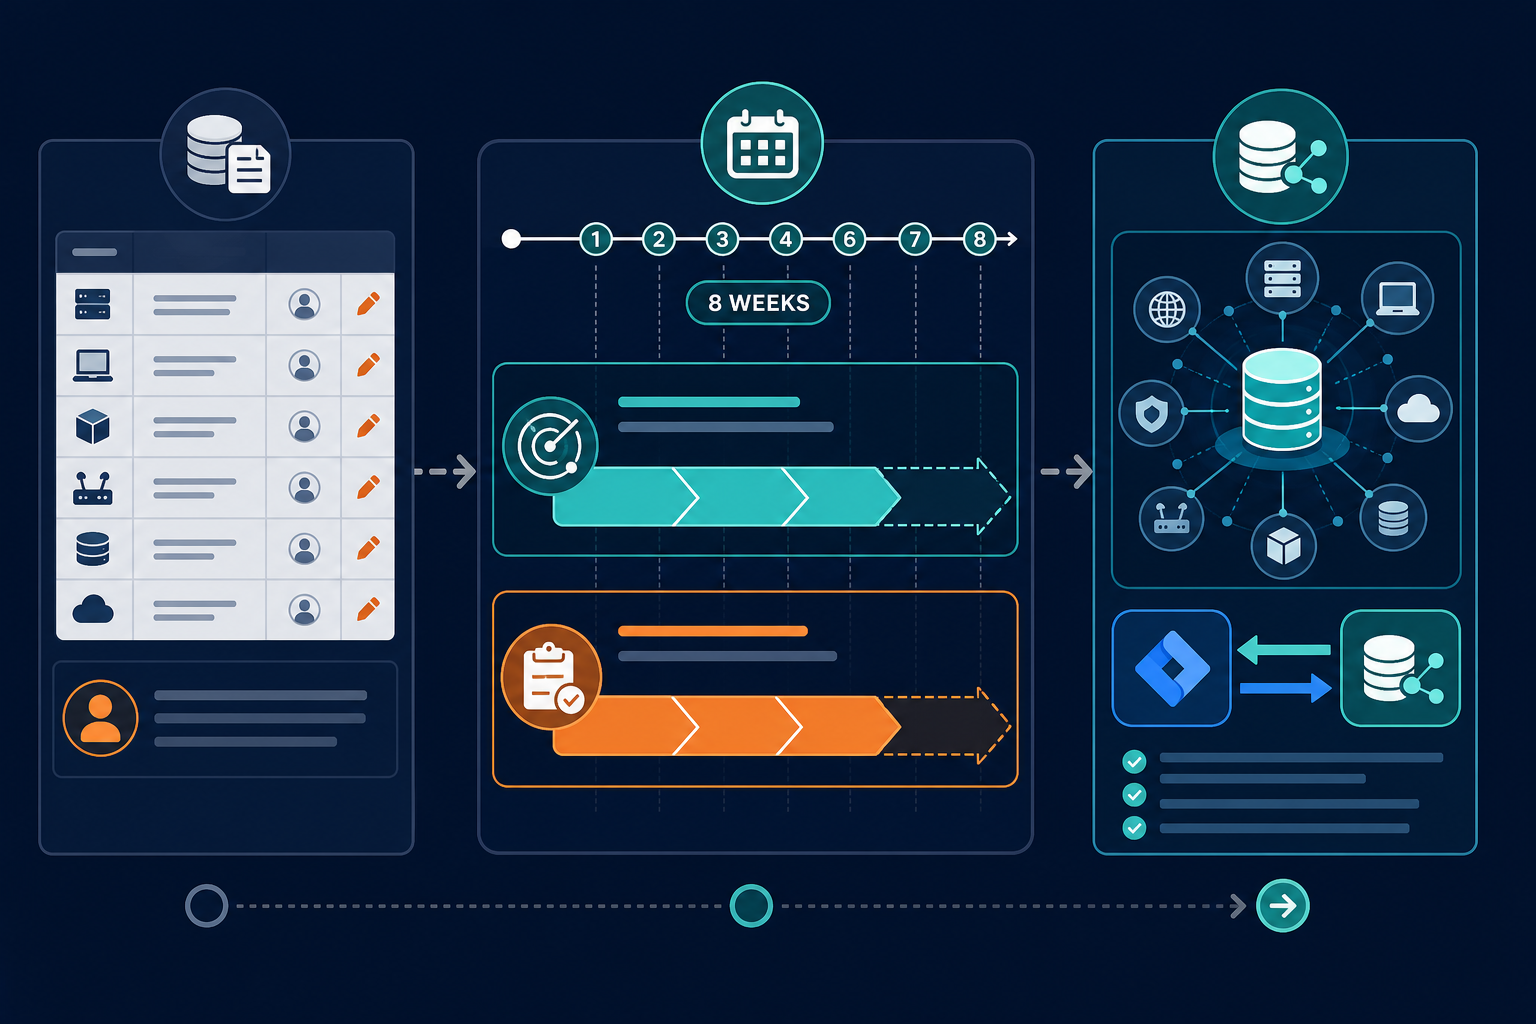
Migration typically runs in three phases: discovery baseline (deploying scans to catalog CIs automatically), data validation (comparing discovered CIs against existing manual records to identify gaps and conflicts), and integration setup (connecting the CMDB to Jira so CI data surfaces in tickets). Teams with 3,000 to 15,000 CIs typically complete this in six to ten weeks.
The migration: 8 weeks, 11,300 CIs
The migration took 8 weeks. At migration completion, our CMDB held 11,300 CIs — 7,100 more than our Jira Assets catalog. Those 7,100 additional CIs had never been manually entered into Jira Assets. The gap included virtual machines spun up for temporary workloads, cloud instances provisioned by individual teams without IT approval, and network devices we had assumed were covered. Several hundred were shadow IT instances provisioned outside the IT approval process — assets our security team had no record of.
The CMDB with automated discovery approach we adopted changed how we thought about the relationship between asset inventory and incident response. An inventory tells you what you have. A discovery-sourced CMDB tells you what you have, how it is connected, what changed, and what breaks if it fails.
How many unknown CIs does a typical discovery scan surface?
In post-migration audits with Virima customers, organizations with 3,000 to 5,000 manually tracked assets typically discover 40 to 60 percent more CIs when automated discovery is deployed for the first time. The gap reflects workloads provisioned without IT oversight, temporary instances that became permanent, and network devices never entered into the manual catalog.
The first incident after migration
Our first P2 incident after migration completed was in December 2024. An application server in our payments cluster began responding slowly.
The engineer on call opened a Jira ticket. The CI record surfaced automatically: server name, owner, 14 dependent services, a configuration change applied 36 hours earlier, and an open vulnerability record flagged via NIST NVD lookup. The ViVID™ service map loaded directly from the Jira ticket — the dependency chain Virima’s discovery scans had maintained for six weeks — and showed two downstream services already at elevated latency. She identified the configuration change as the likely cause within 9 minutes.
Total incident resolution time: 1.8 hours.
The September incident and the December incident were comparable in infrastructure complexity. The difference was 2.9 hours of resolution time — a 62% reduction in MTTR — and the entirety of that difference was data access.
That is what discovery-sourced ground truth provides during incident response. The same engineers, with accurate information at the moment they needed it.
What does Virima’s Jira integration add beyond Jira Assets?
Virima’s Jira integration surfaces discovery-sourced CI data directly in Jira incident tickets: current CI ownership, service associations, open vulnerabilities, recent change records, and the service dependency map. This data is maintained through automated scans rather than manual entry, keeping CI context in tickets accurate without team overhead.
If your team is still using Jira Assets as your primary CMDB, see how a discovery-sourced CMDB connects to your Jira environment — schedule a demo with Virima.