Our Jira Team Had Zero CI Context in Every Ticket. Here’s What That Cost Us.

The Jira no CI context incident cost has two components: direct downtime and the engineering hours consumed by manual CI identification before any diagnosis can begin. When Jira incident tickets carry no affected configuration item, no service owner, and no dependency map, every response begins with an investigation phase averaging 58 minutes per ticket. Connecting a discovery-sourced CMDB to Jira eliminates this phase and closes the data gap that allows the same root cause to produce repeat incidents months apart.
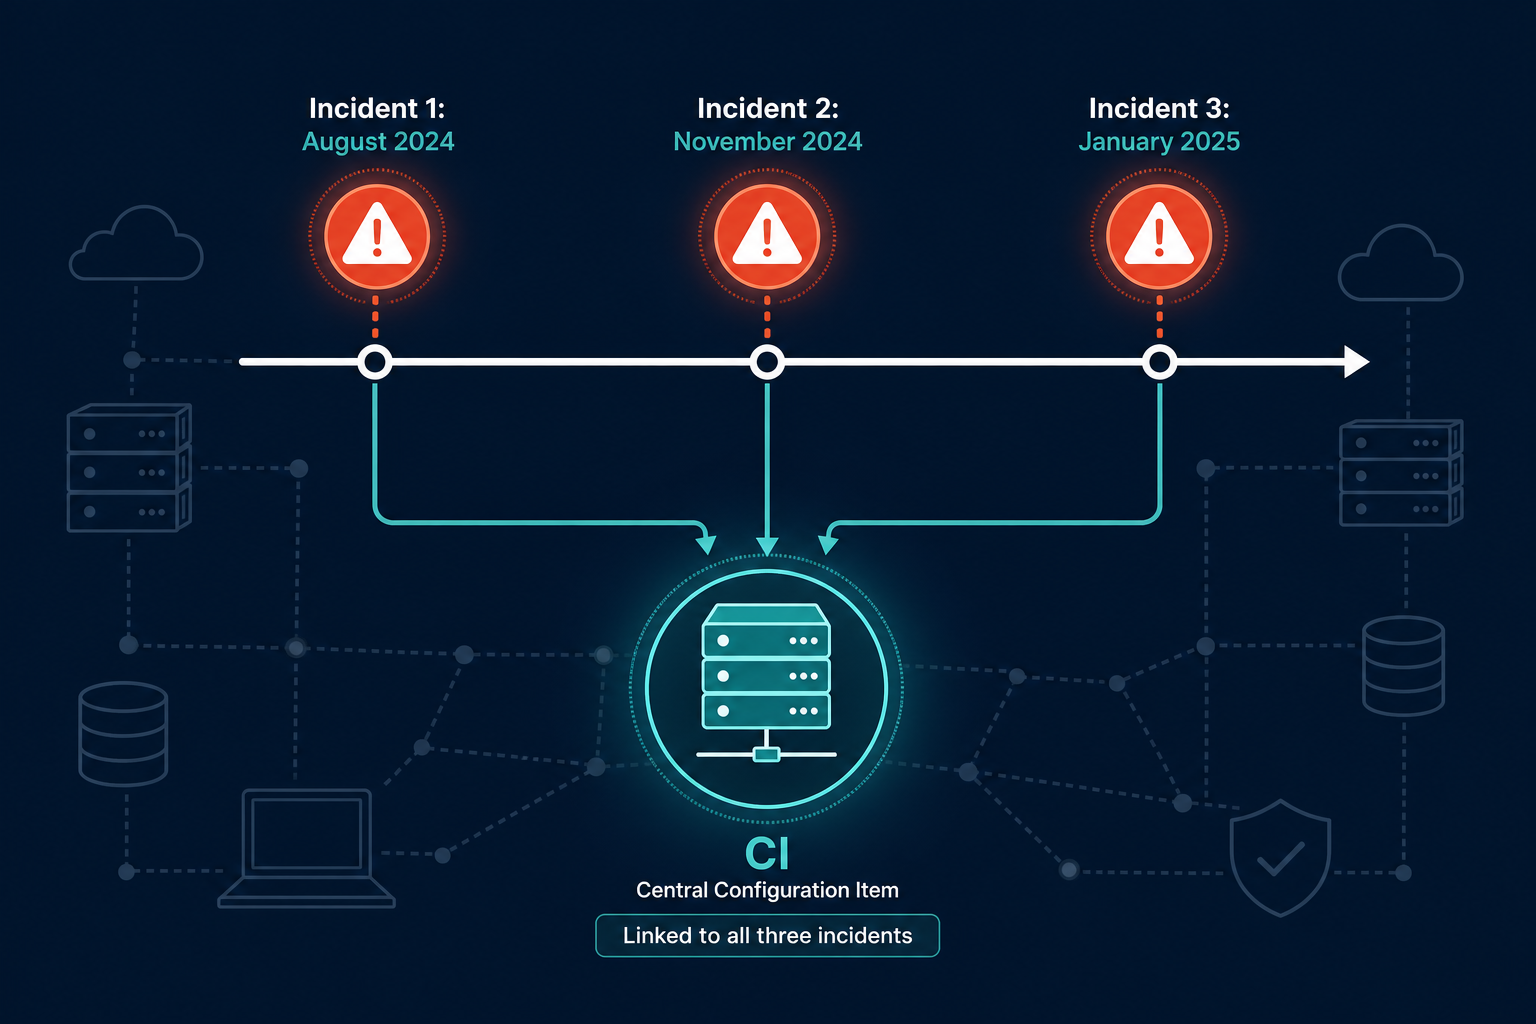
Between August 2024 and January 2025, we experienced three production incidents. Each took between 2.9 and 3.2 hours to resolve. Each was caused by the same misconfigured load balancer routing rule. Not one of our engineers connected them. Our Jira tickets contained zero CI context — no shared data anchor that could have pointed to the same component across three separate events.
The details below are drawn from a customer engagement, with identifying details anonymized.
What “zero CI context” actually means
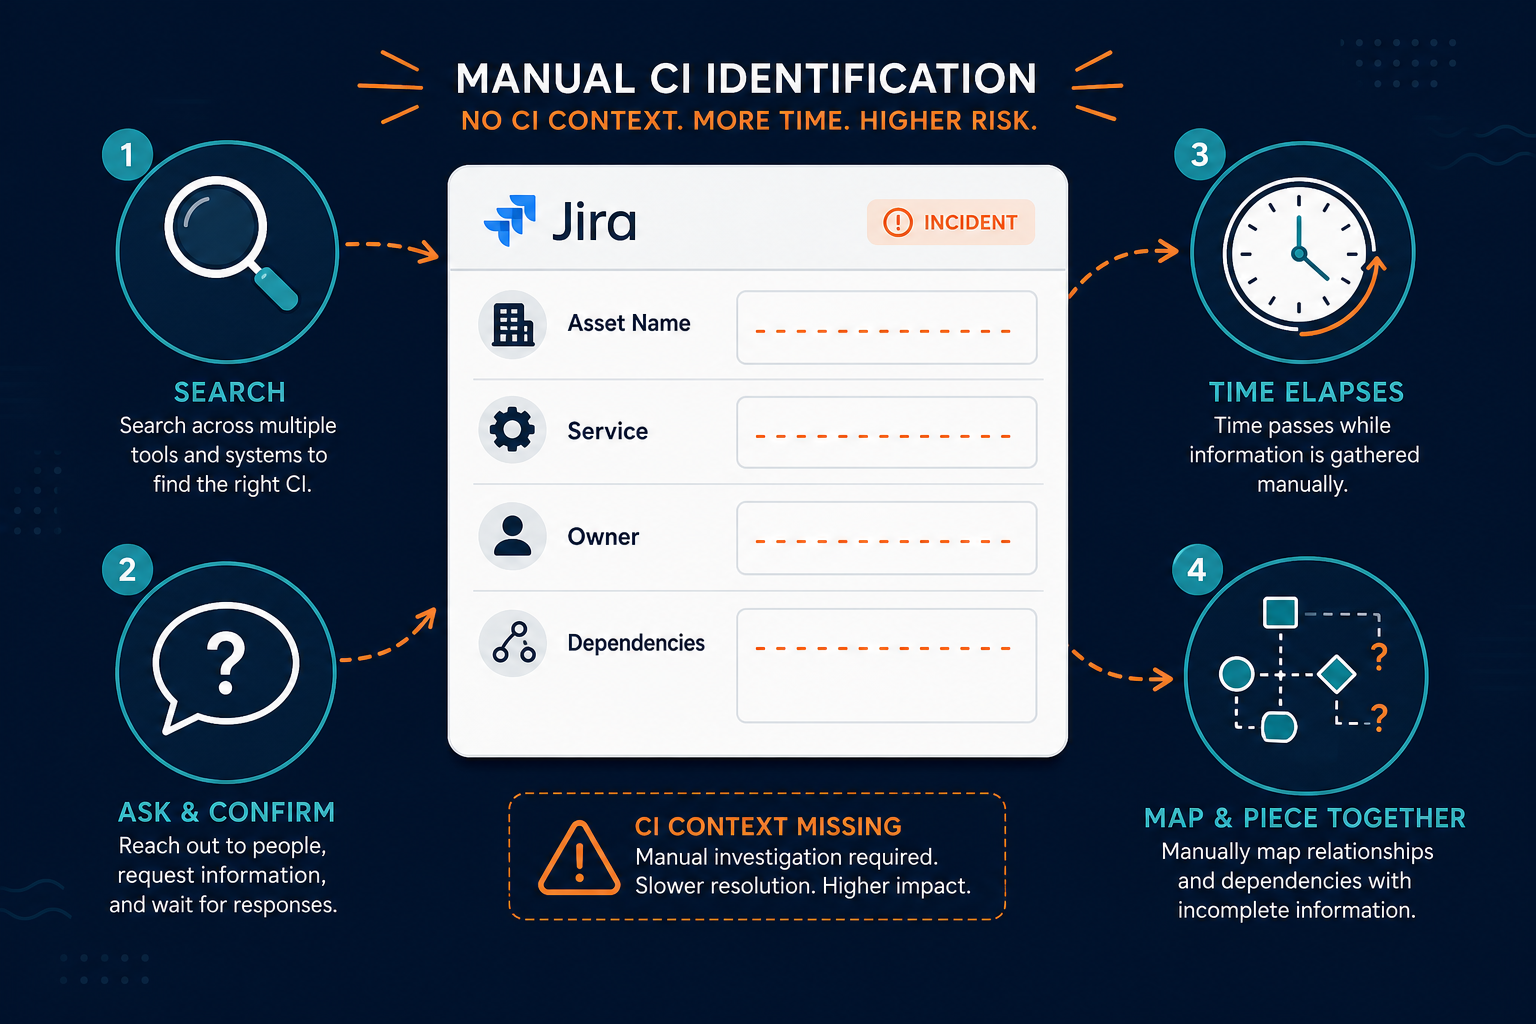
When we say zero CI context, we mean: no affected configuration item (a CI: any IT asset or component tracked in the CMDB), no service association, no upstream dependency map, no CI owner, no change history. Every ITSM incident ticket our team of 22 engineers opened in Jira was a blank slate.
A description field with someone’s written summary of what seemed broken. A priority label. A reporter name. That was it.
Our team processed over 1,400 Jira tickets per month during this period. Across every one, the same pattern held: responders began by asking around. Which server is this? Who owns that service? What changed this week? The answers came through Slack, Teams calls, and direct messages to whoever happened to know the infrastructure in question.
Three incidents. One root cause. Zero connection.
In August 2024, our payments service degraded for 3.2 hours on a Thursday afternoon. Root cause traced to a misconfigured routing rule on a load balancer in our primary data center. Rule corrected, service restored. Ticket closed.
In November 2024, the same payments service degraded for 2.9 hours on a Tuesday morning. Same load balancer, same routing rule — reintroduced by a change that never referenced the August incident. No shared CI record meant no link between the two events.
In January 2025, it happened again. 3.2 hours. Same component. Same failure mode. Total downtime across the three incidents: 9.3 hours. At our organization’s estimated $5,000-per-hour impact figure — a conservative internal benchmark (industry estimates for critical enterprise services run significantly higher, per Gartner’s published downtime research) — that is $46,500 in measurable cost. Every dollar of it was preventable.
Without a CI record in each ticket, there is no shared reference point linking separate incidents to the same infrastructure component. Responders treat each ticket as a new problem. The root cause gets fixed in isolation each time. But the structural conditions that let the misconfiguration recur stay invisible until someone runs a manual keyword search.
To see how CI-to-ticket mapping closes this gap before the pattern accumulates, explore Virima’s Jira integration.
The investigation tax we paid on every ticket
We tracked investigation time across a sample of 80 tickets from Q3 2024. The average time from ticket open to first confirmed CI identification was 58 minutes. For P1 incidents, that number rose to 71 minutes (based on internal analysis, 2024–2025).
At 22 engineers with a blended hourly cost of $95, and an estimated 40 incident tickets per month where investigation time exceeded 30 minutes, we were spending over $29,000 per month in engineering hours on manual CI lookup — not on solving problems, but on finding out what the problem was touching.
Five CI fields that eliminate the investigation phase
Effective CI context in a Jira incident ticket requires five fields:
- The affected CI name and type
- Its current owner
- The services that depend on it
- Open incidents or changes in the prior 72 hours
- A discovery timestamp confirming last-verified state
These five fields eliminate the manual investigation phase that consumes the first 30 to 60 minutes of most incident responses.
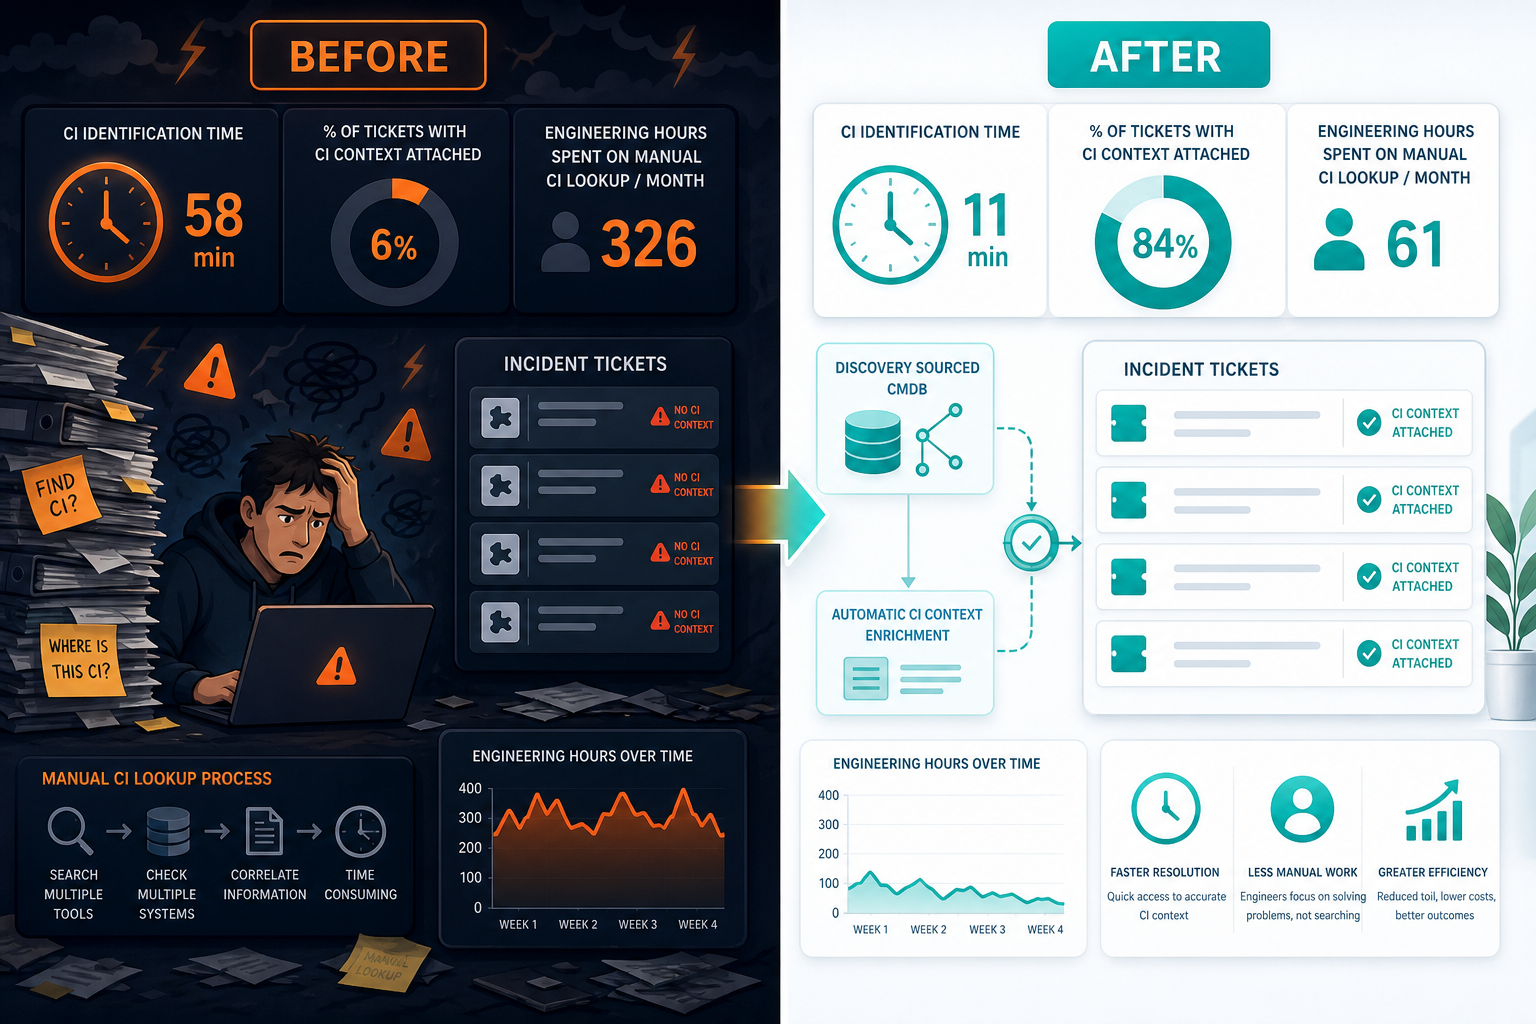
The Jira integration that connected our CMDB to tickets reduced that identification time from 58 minutes to 11 minutes within 45 days of deployment.
What the data environment looked like
Our IT discovery covered approximately 6,800 CIs at the time of the November incident. The load balancer at the center of all three incidents was in the CMDB. Its routing configuration, service associations, and last-modified date were all recorded.
None of that data was ever connected to a Jira ticket, not because the data did not exist, but because there was no bridge between our asset management environment and our ticketing workflow. Two systems, no integration, and a team that had adapted to the gap by treating their colleagues as a human CI lookup layer.
Discovering a configuration item in a war room conversation is not a discovery process; it is a guessing game with deadlines.
Under incident pressure, responders default to speed. Looking up a CI in a separate CMDB interface, copying the record identifier, and attaching it to the Jira ticket adds minutes to a process that already feels too slow. Without automatic CI attachment at ticket creation, manual enrichment rarely happens, and the ticket record is permanently incomplete.
The structural problem behind the symptom
A pre-integration audit we ran in February 2025 found 1,140 CIs with blank ownership fields. It found 427 CIs associated with services that had been renamed or restructured in 2024 but never updated in the CMDB. It found 89 CIs that referenced physical hardware decommissioned more than 8 months earlier.
This is the sequence that matters: build a CMDB on accurate, discovery-sourced data, then connect it to ticketing. Connecting first amplifies whatever quality level your CMDB is at, good or bad.
For a structured approach to CMDB accuracy before integration, see our CMDB best practices guide.
What changed after the integration
We deployed our Jira and CMDB integration in February 2025, following a three-week data quality project. Within 45 days:
- CI identification time dropped from 58 minutes to 11 minutes
- Tickets with CI context attached rose from 6% to 84%
- Engineering hours on manual CI lookup fell from 326 to 61 per month
- Every repeat incident was linked to its prior CI appearance — pattern detection became automatic
That is what Trusted Runtime Truth looks like applied to incident management. Not a reporting layer. A live data connection that makes the ticket itself smarter from the moment it opens.
For teams operating ViVID service maps alongside their ticketing workflow, the integration extends further: responders can pull up the full blast radius of an affected CI from inside the incident ticket, identifying services at risk before they fail, not after.
The cost of missing CI context in Jira has two components: direct downtime (calculated per hour of service impact) and indirect engineering waste (hours spent on manual CI identification during each incident). Organizations typically undercount the second component. At $95 per engineer-hour and 40+ CI-investigation incidents per month, the annual waste frequently exceeds $300,000 before any P1 impact is factored in.
What the post-mortem should have surfaced
After our January 2025 incident, we found our post-mortem template had no CI field. It asked what process failed. It did not ask which CI was involved. Adding a required CI field to the Jira post-mortem template was the cheapest intervention we made in this entire project. It took 15 minutes. It would have caught the pattern after the second incident.
If your team is running Jira Service Management without CI context in incident tickets, this pattern is already accumulating in your ticket history. If your team is still spending 30 to 60 minutes identifying the affected CI before diagnosis can begin, Virima’s Jira integration changes that. See the before-and-after in your own environment — schedule a 30-minute demo.